Currently trying to simulate a NOEL-V release 2025.1-b4296 core with Modelsim. It works for a good portion of simulation, but then break with the following error:
Failure: X in data going to cache
And the source of it is the process ‘comb’ of iunv.vhd file at the line 13574.
It does appear after a series of communication with RAM and ROM through ‘srctrl’ entity, but those show that they’ve given the AHB bus only actual values with no ‘U‘ stated signals in them. Funny enough, when synthesized with Quartus and loaded into an FPGA it runs smoothly and without errors. Concluding, I’m thinking there’s something going on with data transfer, but I can’t catched it from looking at the top level alone.
I’m already refering to the ‘r‘ register from the ‘iunv’ file to track the changes code does to the core, but I would also love to track ‘xn’ registers values and currently executing opcode in order to debug what’s exactly wrong going on with the simulation. Those that I’ve found are labeled as ‘variable‘ types, so I can’t check out their dynamic values.
What signals and register can I track in Modelsim from ‘iunv‘ or other cpu entities to debug this? Ideally, fields smilliar to what can be pulled out with JTAG would be preferred.
Is it possible that you are reading some register that has not been initialised? Depending on configuration, registers may be in RAM and then not possible to zero at reset. FPGA:s normally do start with RAM initialised to zero, which could be why it works fine then.
Anyway, it should be possible to trace what data is going towards cache in your case. The assert is looking at me_stdata, which comes from data_out in the call to stdata_unit(). As it happens, that procedure only has the r signal as input.
stdata_unit() is responsible for selecting between incoming data from register file read or something that is forwarded from earlier instructions in the pipeline. While it would be possible to look at the r signal in Modelsim to figure out which of the ten or so possible data sources are selected when you get the X, that is probably not the easiest way if you are unfamiliar with our pipeline. Rather, I would suggest that you insert report statements in each branch of the various if-statements.
Since the error apparently happens quickly in your case, the extra debug output should not be too bad. Otherwise, you could in various ways make the reports not start until closer to the expected error. Anyway, the last such report you see before the assert should indicate where from you get the X.
With some luck, the report statements combined with the content of the r signal at assert should point you towards what’s going wrong.
If needed, it would also be possible to have a breakpoint in stdata_unit(), to enable stepping through the code. But you would probably want to start with the report statements mentioned to be able to figure out a good way to do that.
By the way, Modelsim is capable of showing you variables. It just isn’t very obvious how to go about it.
Thanks for your reply and advice. I get to find what was causing the error. But still, struggling to find the solution.
First of all, and I think that’s the funniest thing, switching the assert level from failure to warning didn’t bring any errors and CPU haven’t grind to a halt. I suppose that correlates with synthesized core running okay too. Perhaps there’s errors crawling inside the FPGA too, but it manages to handle them.
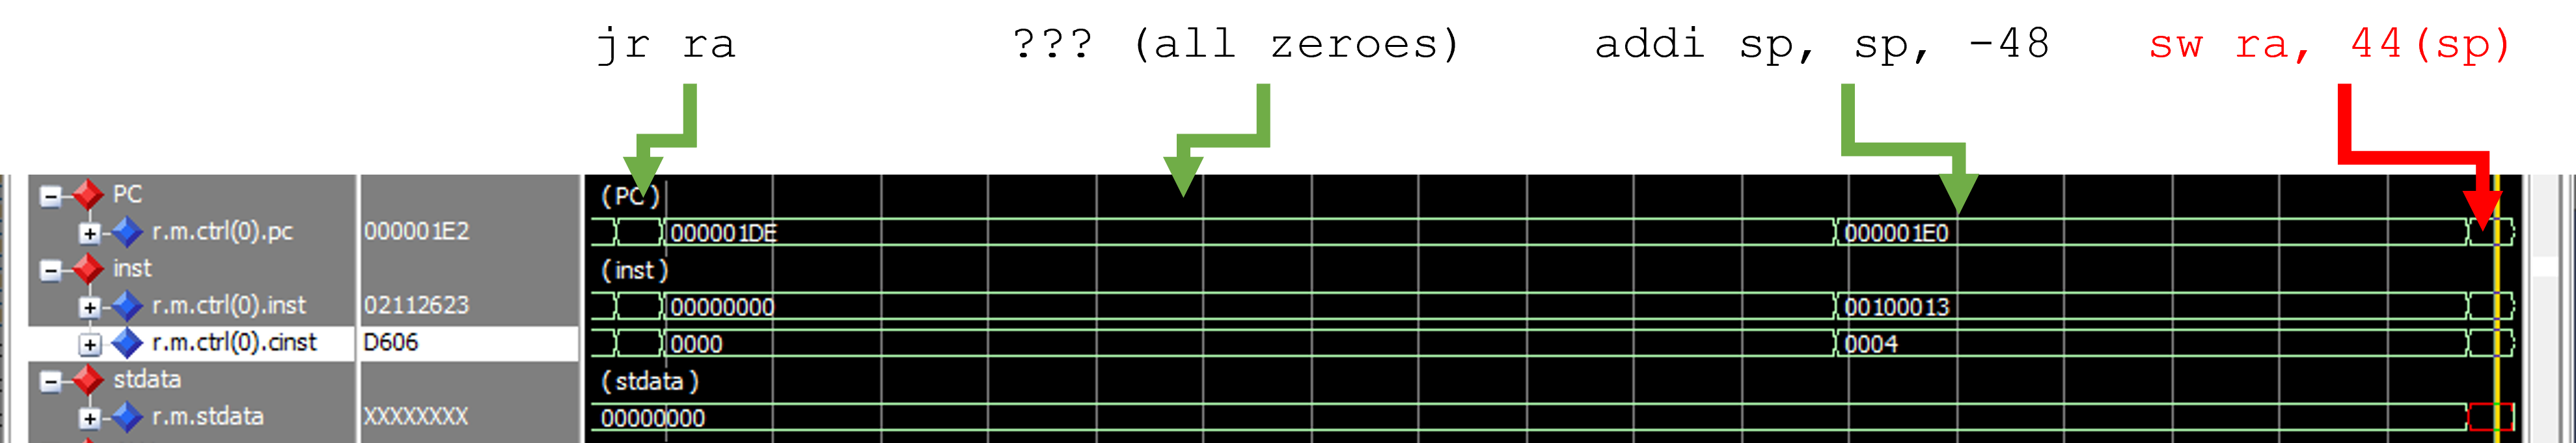
Second, what was causing the errors in the first place. They all arise in ‘sw‘ instructions. But not all of them, but in very specific cases. I’m not sure if that’s correct behaviour, but I found that when encountering ‘jr ra‘ instruction in any subprogram, core would still walk 3 additional PC addresses. I assume core needs time to prepare before the jump, but at the same time, branching instructions don’t need those 3 cycles and execute the jump in the very first cycle. I also assume those 3 instructions are ignored, because when landing on ‘sw‘ one, RAM never received any writing signals.
By the looks of thing, errors arises when only when one subprogram ends, PC takes additional 3 steps and lands in the next subprogram that was in memory map (first oscillogram).
Worth noting, that I run an experiment. I was using XPACK GCC code compiler the entire time. I decided to try Gaisler’s edited GCC for compiling. The only difference in code was addition of one more address separating subprograms. That DID resolve most of the problems as PC never landed on ‘sw‘ instruction. Yet, some of the errors remained.
The questions I’m most interested in are:
Can you explain this PC behaviour with ‘jr ra‘ instructions. And do you have any ideas or explanaition why it was causing problems with ‘sw‘ instructions?
Where can I learn more about NOEL’s ALU flow? Haven’t found anything so far
Update: …turns out general purpose registers are not initializerd 0 after reset signal. Loading anything into them at the start of the simulations solved the remaining problems.
Explicitly setting registers to something at startup is indeed normally necessary.
Regarding the NOEL-V pipeline, you should be able to find various presentations we have done around the Web or on YouTube. In short, we have an in-order dual-issue pipeline with seven stages:
The pipeline splits in two after the REGISTER ACCESS stage, which is also where most required bubbles would be inserted. All instructions touching memory/CSR/FPU go into lane 0, branches/jumps into lane 1 - the rest can generally go in either, and there is some lane swapping capability.
There is branch prediction, so (when properly trained) branches should mostly happen immediately in the FETCH stage, inserting no bubbles in the pipeline. Branches that are incorrectly predicted will be dealt with at various later stages in the pipeline - which then needs to be flushed of all the mispredicted content that has entered after the branch.
Without prediction (or when it fails), there is no choice but to throw away later instructions that have speculatively been allowed to enter the pipeline. This is what is happening with your JR.
Not sure exactly what you mean with “ALU flow”. If you are really asking about the pipeline - see above, and check the internet. Perhaps we should add some links to that stuff from the NOEL-V web page.
The actual ALUs (depending on configuration, there are up to four of them - one per pipeline in both the EXECUTE and EXCEPTION stages) are in the alunv.vhd package.
Nothing terribly interesting to see there, though.
The main pipeline is iunv.vhd. For being as complicated as it is, the code is reasonably readable, as long as you do not try to dig into too much detail (it also helps to be familiar with software development, since our code-style can look a bit strange otherwise).